This has been an abnormally slow winter for ice formation. MLive, looking at data from the NOAA Great Lakes Environmental Research Lab (GLERL), recently announced “Ice cover on Great Lakes at near record low.”
We’re working on adding ice data to Seagull. There are some great places to check for where ice has (or has not) formed right now:
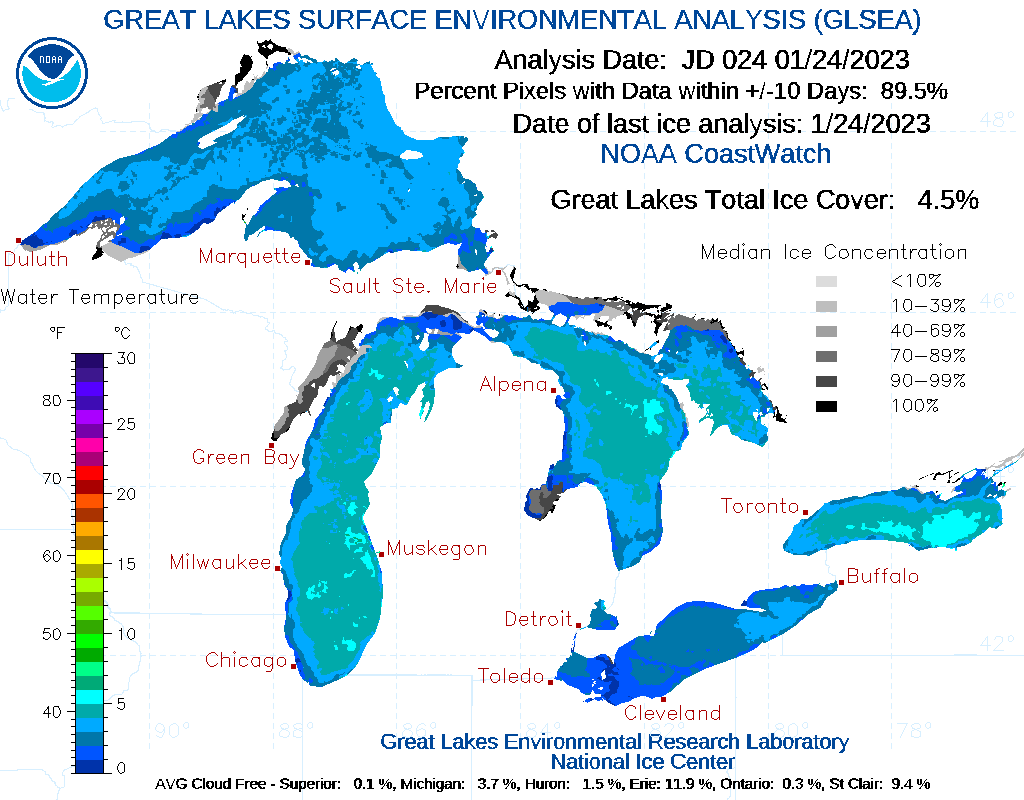
NOAA GLERL’s CoastWatch is a jackpot. There, you can check the Great Lakes Surface Environmental Analysis (GLSEA), which shows clear color demarcations of ice concentration and lake temperature.
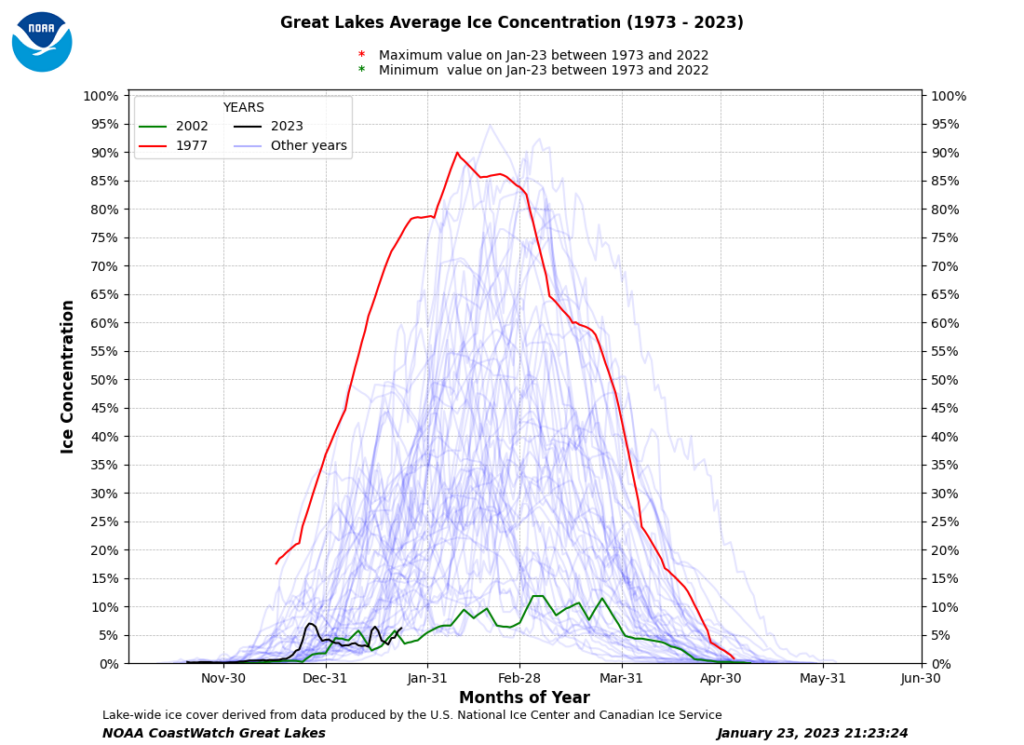
CoastWatch also supplies current ice models and recorded ice levels for the past five decades (notice how low 2023 coverage is so far).
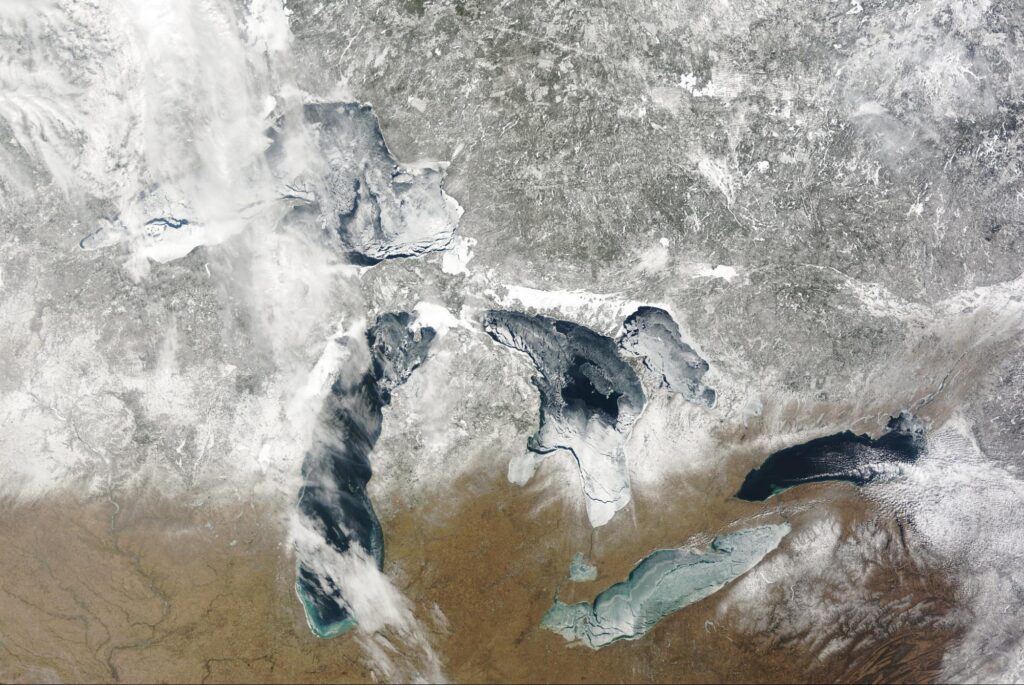
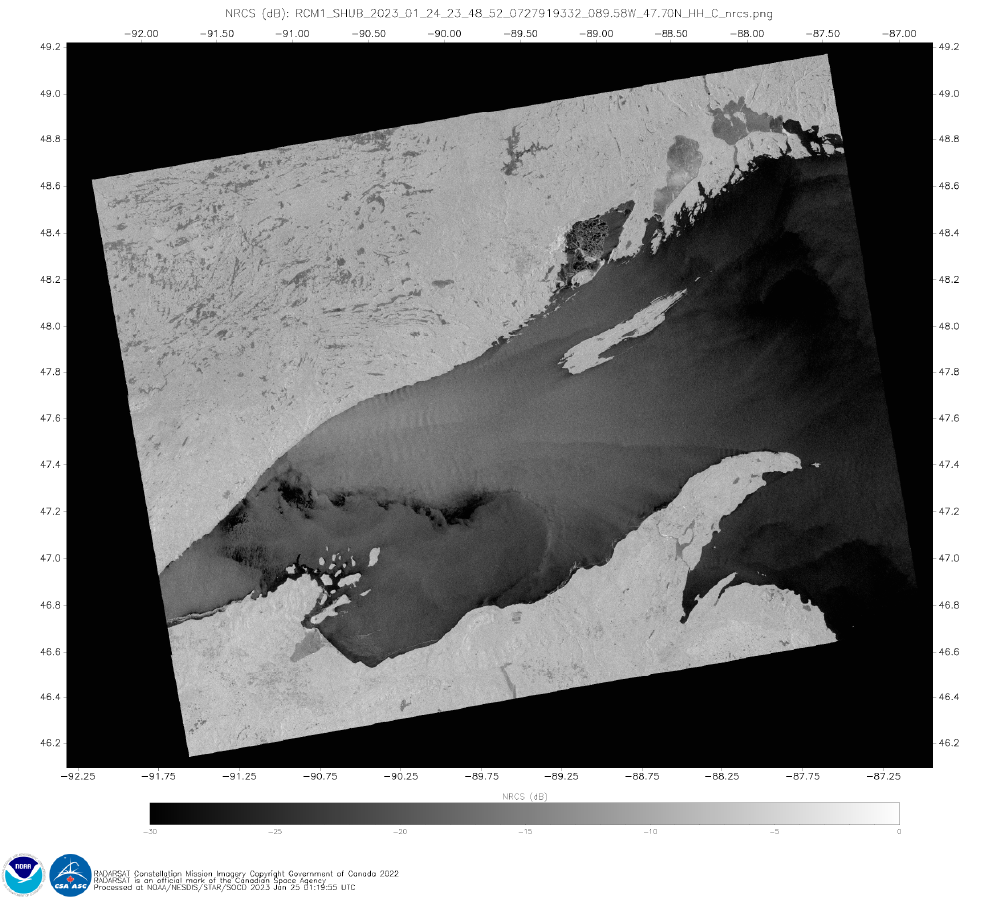
You can even see satellite imagery.
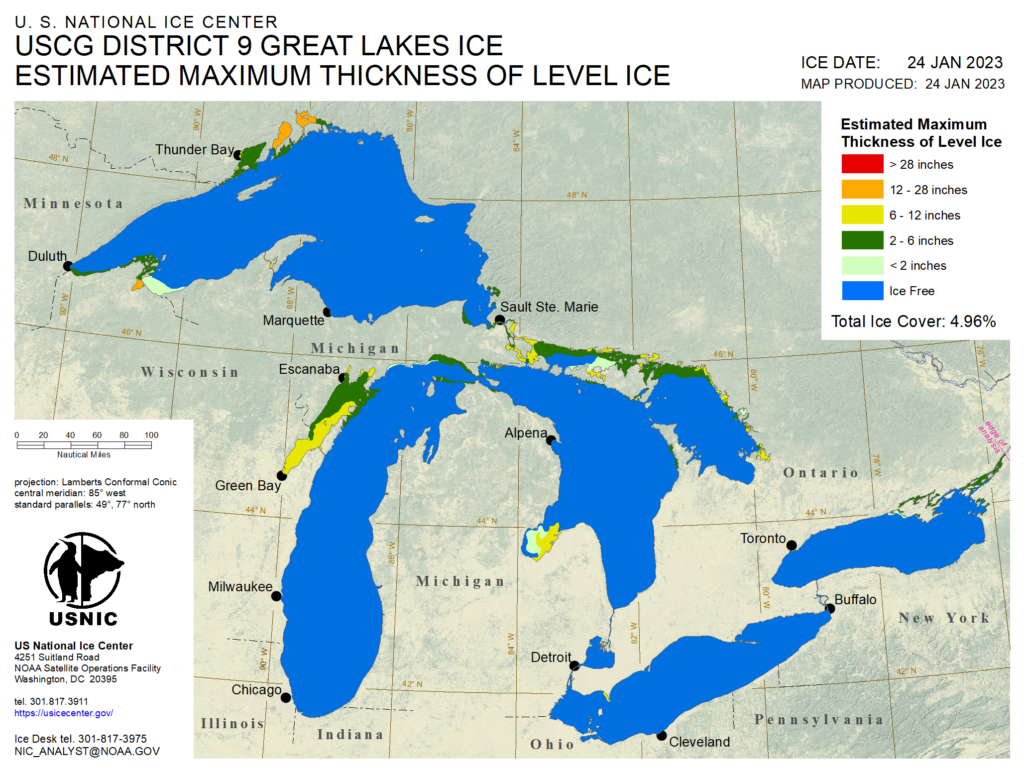
U.S. National Ice Center has some great resources, downloadable map files, and charts, like this one showing ice thickness.
Last, the Canadian Ice Service also puts out charts, historical plots, and helpful daily ice forecasts, in English and French.
Happy observing!