Every fall, buoys around the Great Lakes get retrieved, because they are generally not equipped to handle the winter conditions. Unfortunately, this means that there is a “black box” when it comes to understanding winter dynamics and how they are being impacted by changing conditions.
To attempt to fill this “black box”, three small, lightweight buoys are being deployed at mid-lake locations at the same time the large NDBC “Sentinel” buoys are recovered. The smaller buoys, called spotter buoys (Sofar Ocean), measure waves, barometric pressure, water temperature, and calculate wind direction and speed. This winter marks the fourth year of these “co-located” deployments, which are helping to create year-round datasets.
Michigan Tech’s Great Lakes Research Center is leading the project, with support from GLOS, deploying and managing SPOT-31300C, SPOT-31964C, SPOT-31963C.
These Spotters have helped verify phenomena that would not have been possible otherwise. These include:
- A “warm ring” in Southern Lake Michigan that was 10 degrees warmer than surrounding waters was identified via satellite imagery in 2024. The southern Lake Michigan Spotter buoy was able to confirm the findings.
- A sharp drop in air pressure was captured by the North Huron Spotter buoy early on December 29, dipping to ~28.39 inHg as a strong low-pressure system moved through the Great Lakes. At the same time, significant wave heights rapidly increased, highlighting the tight coupling between falling pressure, strengthening winds, and wave growth. While this was not a hurricane, pressures in this range are comparable to those observed in Category 1 tropical cyclones and are unusually low for the Great Lakes.
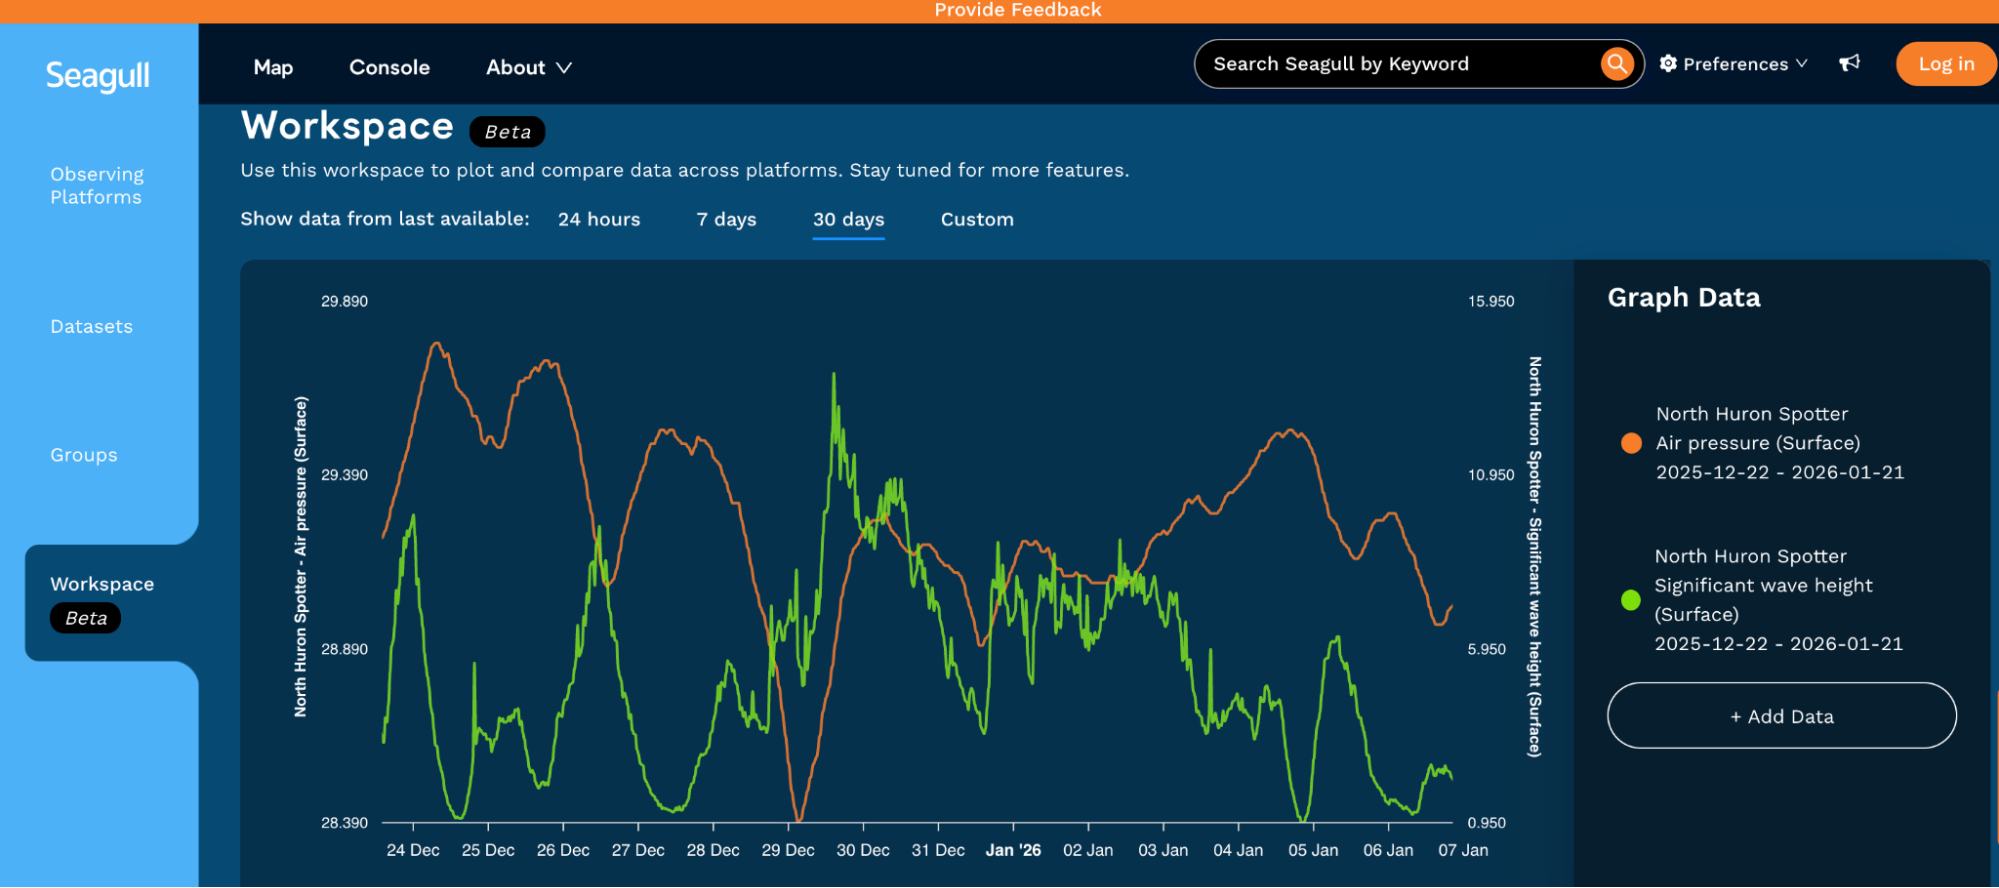
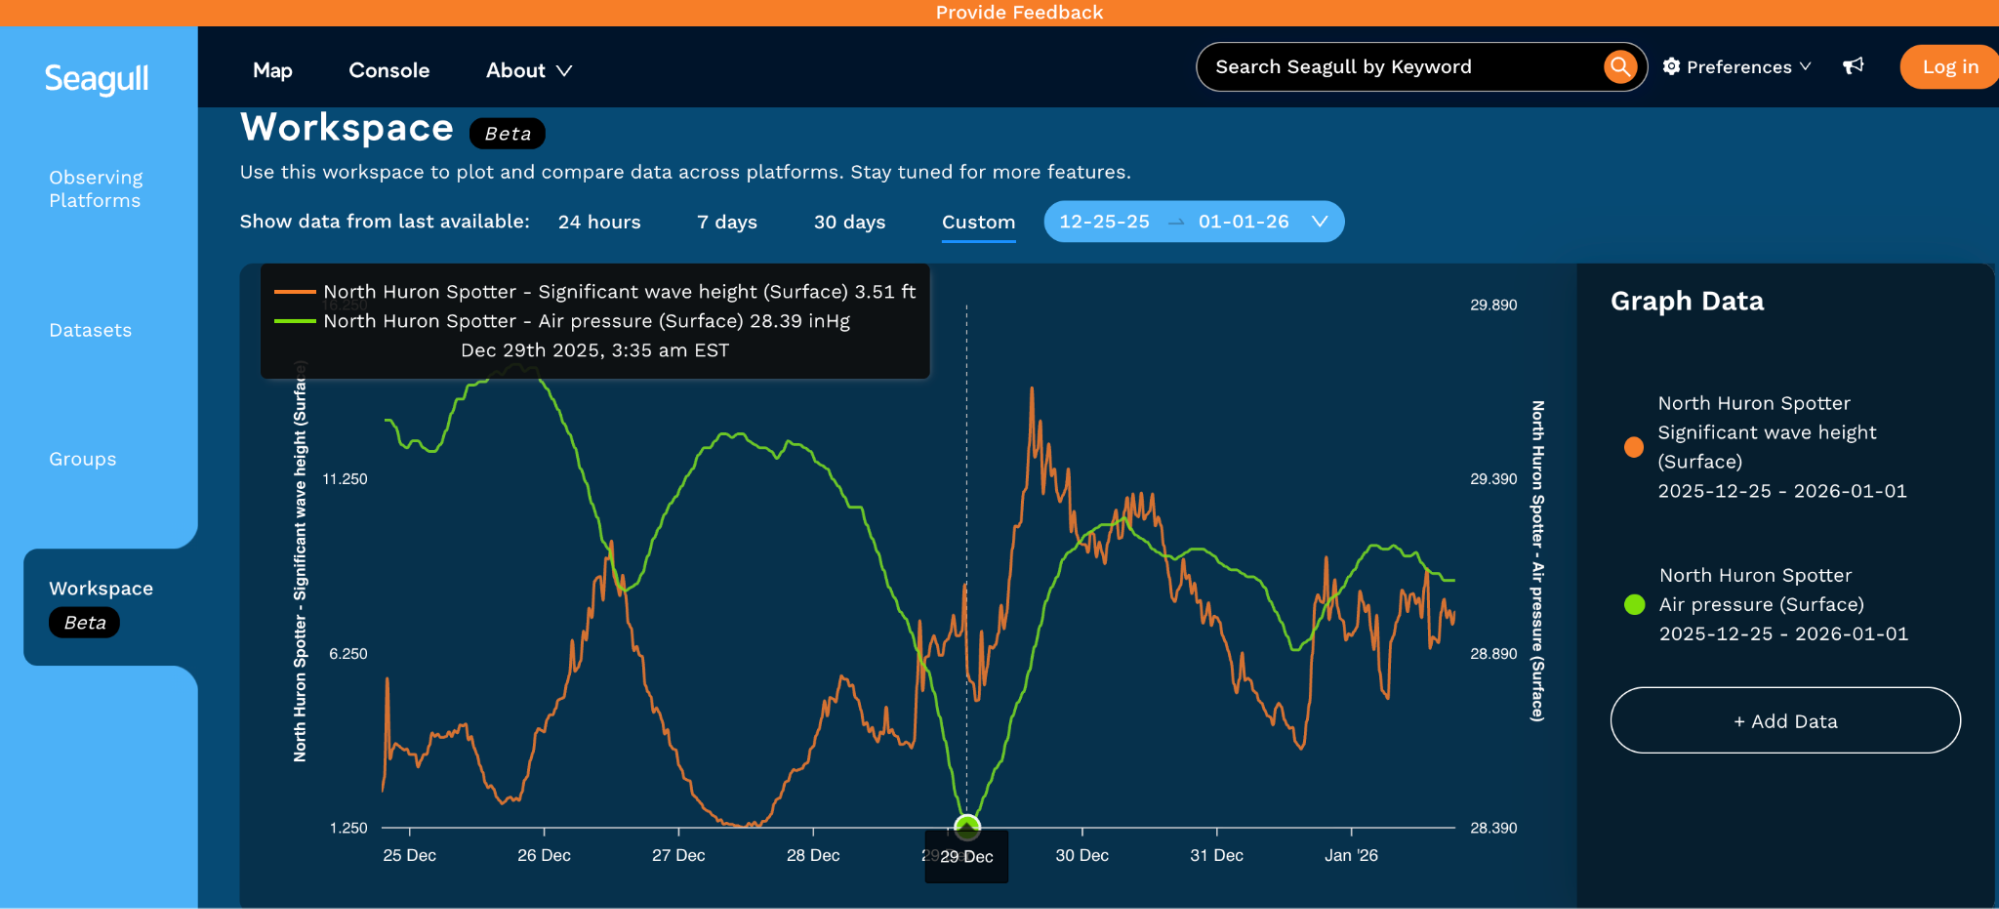
Images captured from Seagull highlighting the low-pressure system as observed by the North Huron spotter buoy in December 2025.
Additionally, Colorado School of Mines is leading a project to evaluate these measurements and integrate the observations into predictive models of the Great Lakes. With the first two years of data, this team of researchers was able to confirm winter wave heights are higher than in typical non-winter months. They also compared NOAA’s Wave Watch 3 model with the collected data and found that the model deviated from observations during peak wave events. This means that before this data existed, forecasters would have been under-predicting the sea state conditions.
The low air pressure event is an example of where these under-predictions can occur. Low pressure systems are associated with rising air, stronger pressure gradients, and faster winds; over large open water like the lakes, that wind transfers energy into the surface, building waves quickly. In short: falling pressure is often an early warning sign of deteriorating weather and rougher water conditions. It can be very hard to say how rough the water will get without observations in the right spot to help train predictive skill.
When reflecting on what we as a community have gained from the project, Hayden Henderson, Research Engineer and MTU PI, said, “Capturing events like this are a reminder of why the Great Lakes are often called the “inland seas” – their vast size allows them to respond to powerful storm systems much like the ocean, producing large waves and truly marine-scale weather conditions. Having the data helps back up those statements.”
by Shelby Brunner – Science and Observations Manager, GLOS
with contributions from
Hayden Henderson – Senior Research Engineer, MTU Great Lakes Research Center
Eric Anderson – Director of the Hydrologic Science & Engineering Program, Colorado School of Mines