The Smart Great Lakes Initiative (SGLi) developed the survey to understand how Great Lakes data are discovered, accessed, and shared. The survey was sent to participants through SGLi partners by email and advertised through GLIN Announce. The 42 responses to the survey were accepted between August 2, 2023 and September 29, 2023.
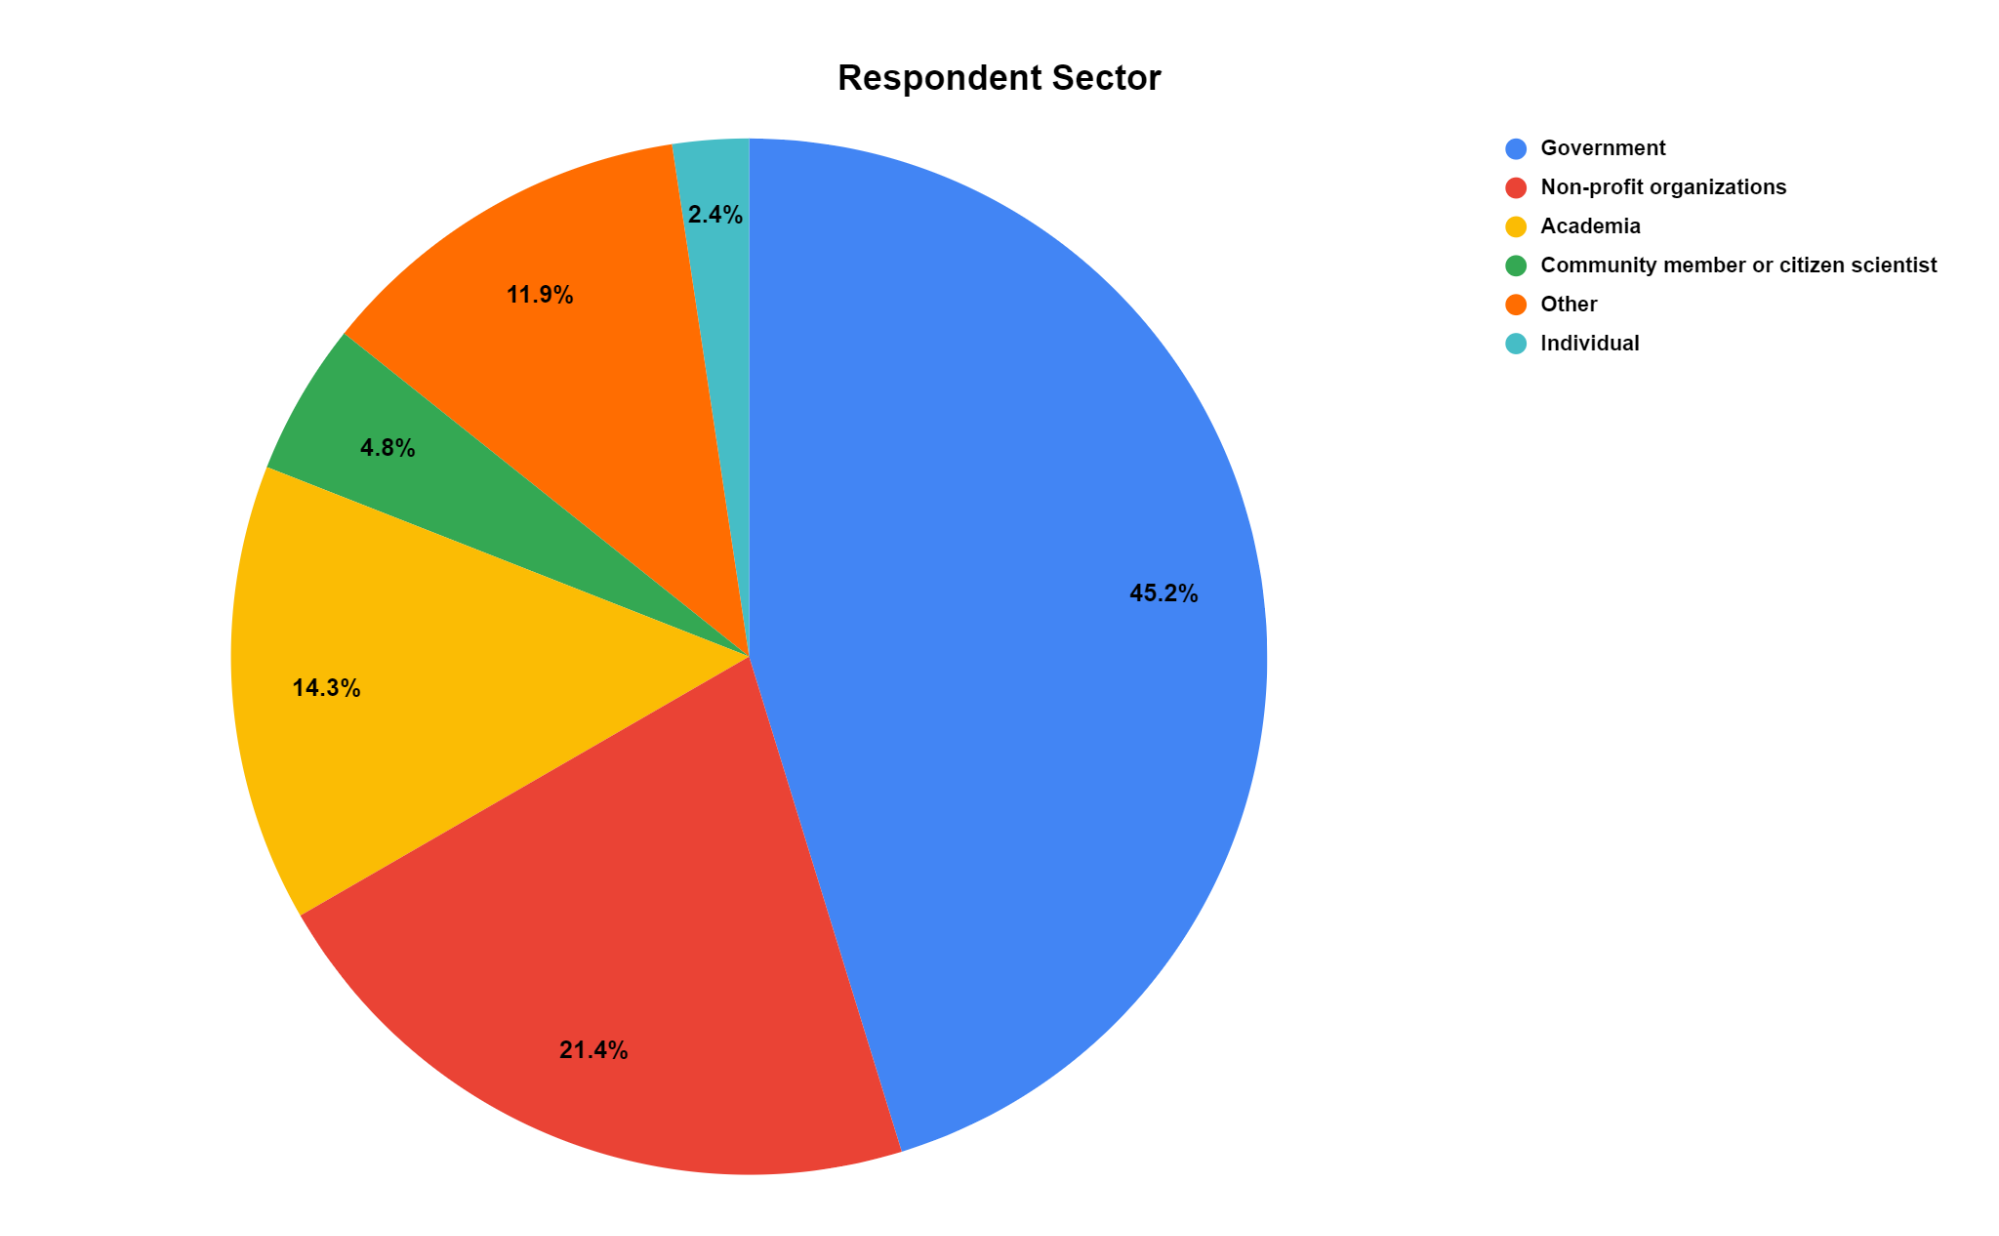
Of the 42 respondents, 19 or 45.24% were from the government, 9 or 21.43% were from non-profit organizations, 6 or 14.29% were from academia, 2 or 4.76% were community members or citizen scientists, and 1 or 2.38% was an individual. There were zero respondents from Indigenous/First Nations/Metis/Tribal organizations and commercial/private companies filling out the survey. Five or 11.9% chose “other” as their sector. Those who chose “other” included a school teacher, a trade organization representative, Cooperative Institute of Great Lakes Research staff, and persons from two Conservation Authorities.
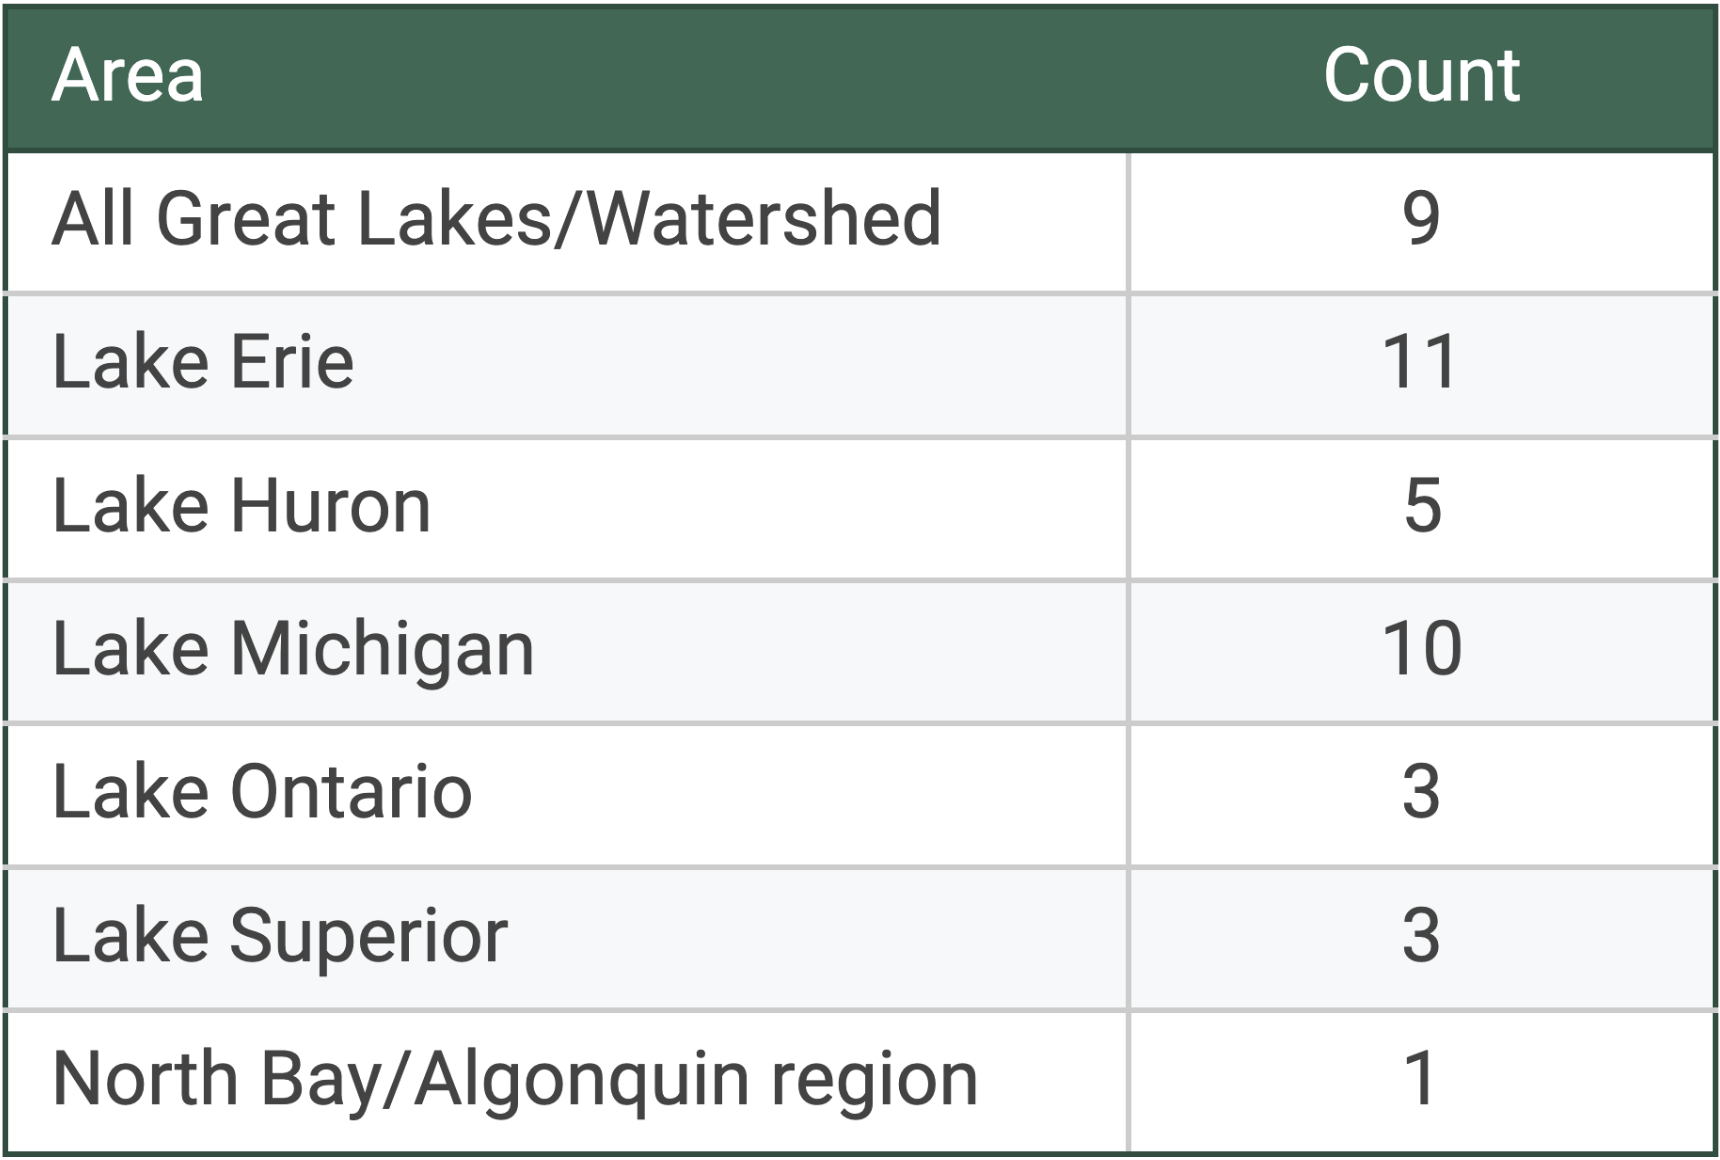
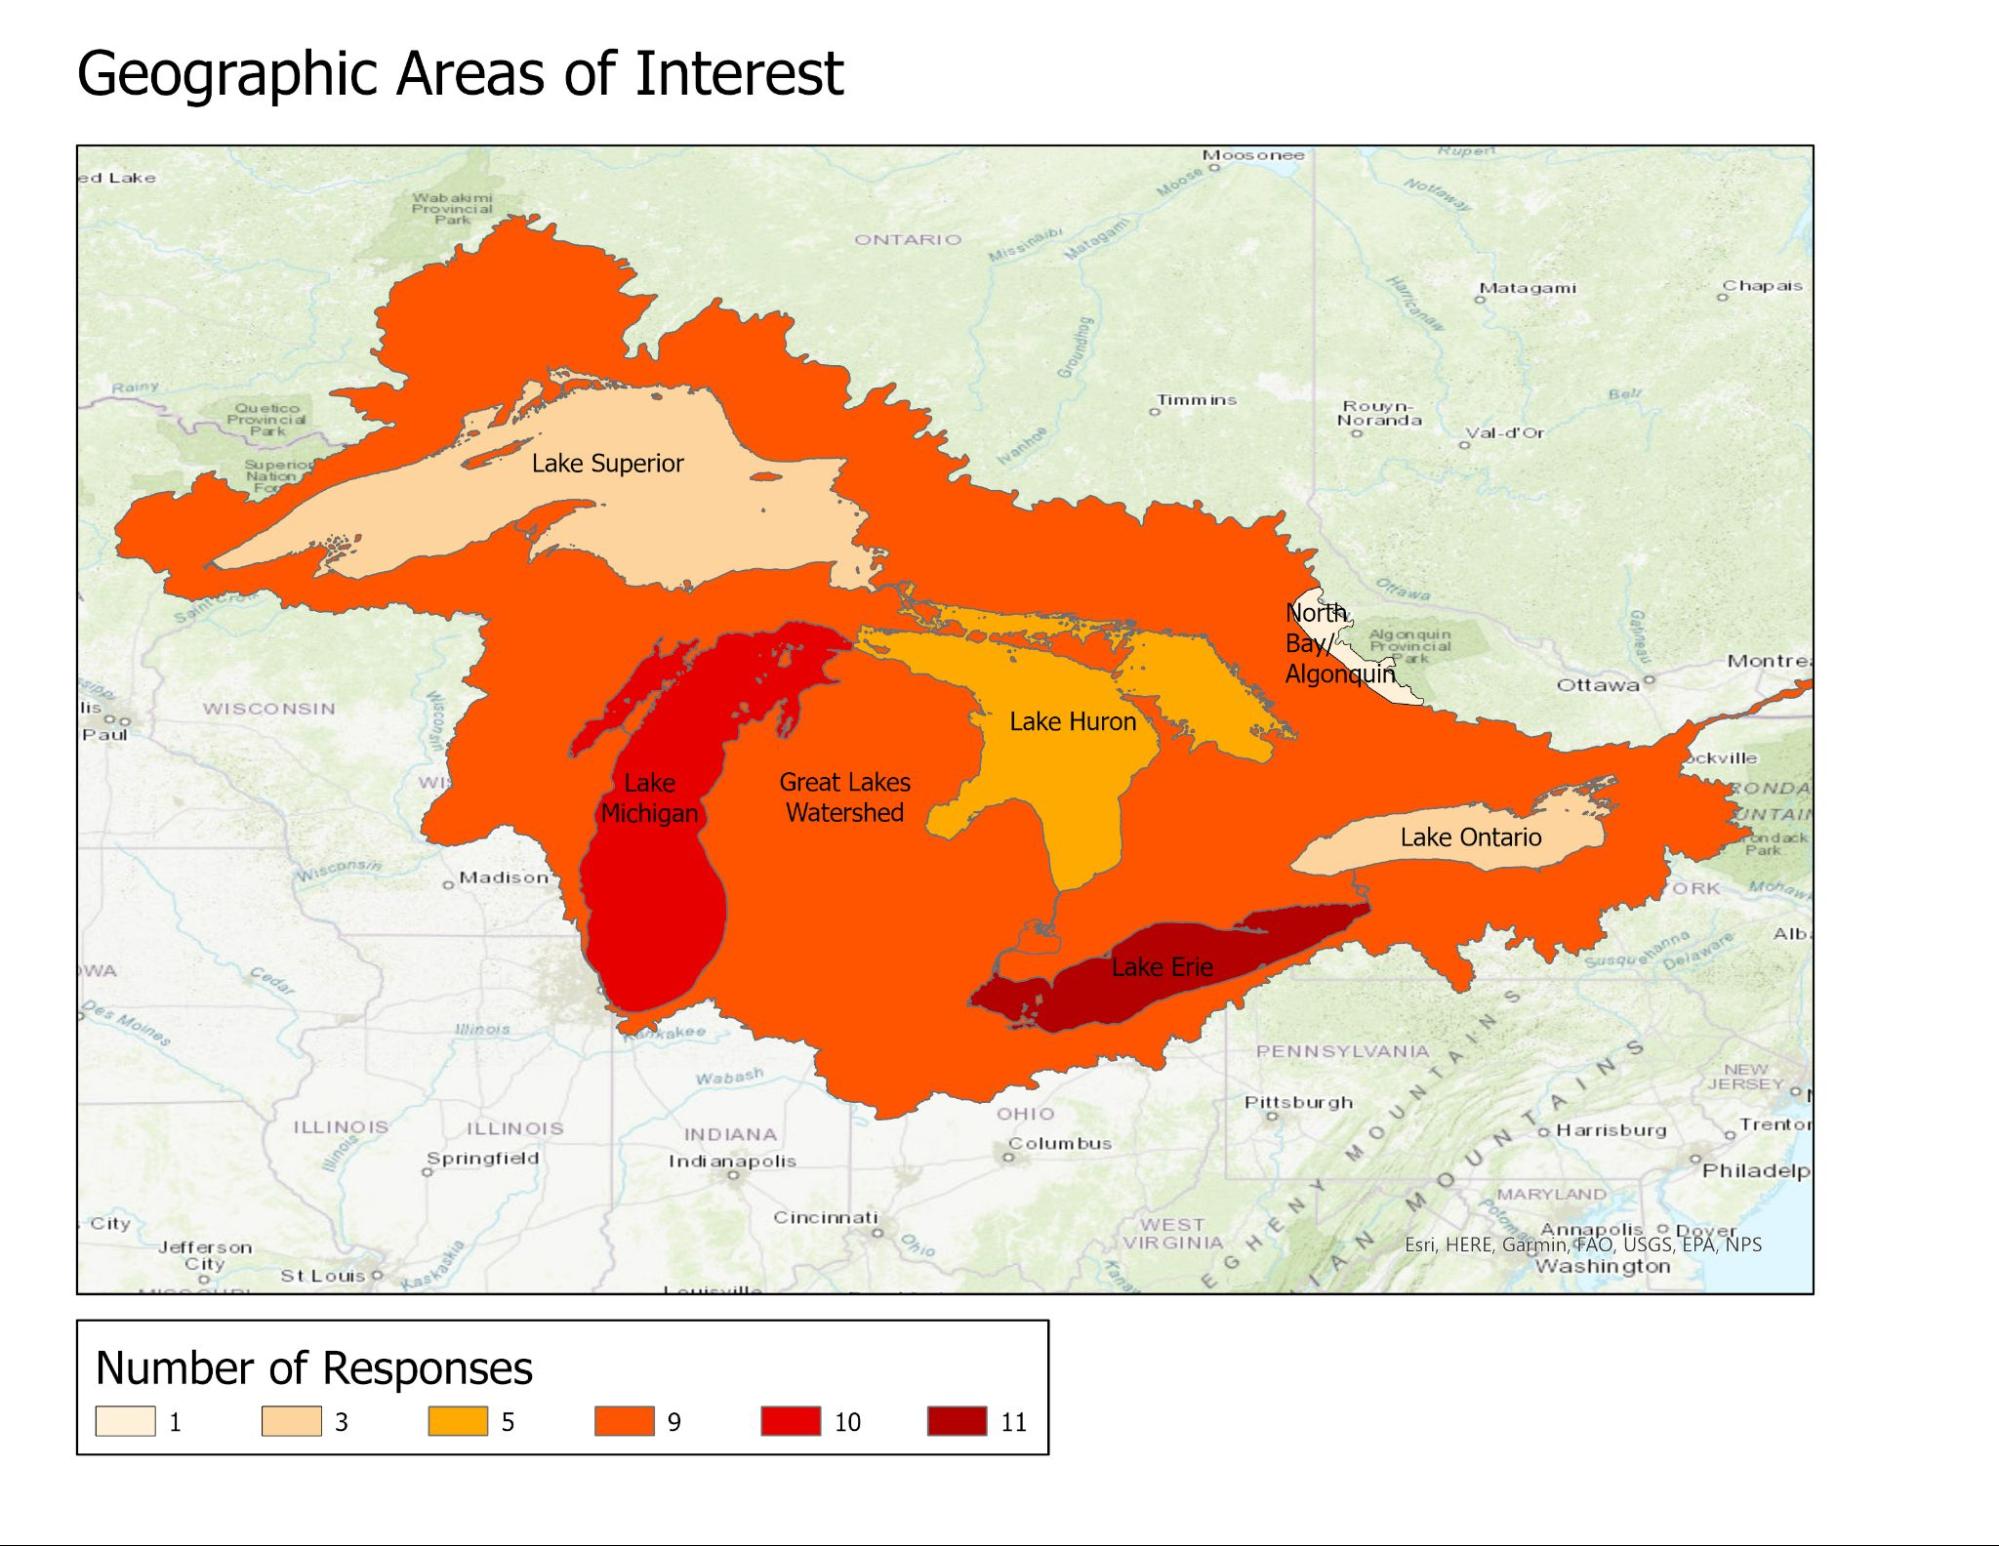
Respondents were asked about their geographic interest. The number of geographies is shown in Table 1 and Figure 2 below.
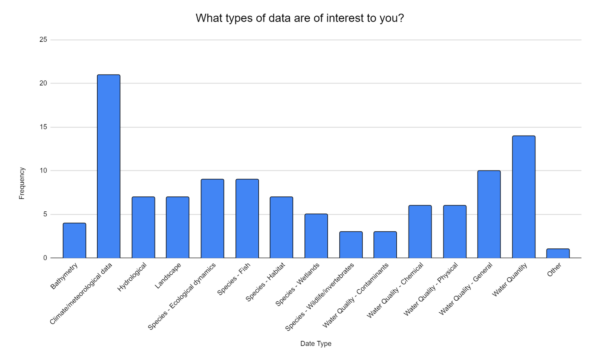
Respondents were then asked what questions are you trying to answer using Great Lakes data and what types of data are of interest to you. Responses ranged from interest in water quality generally to specific needs at a local site. Data types were extrapolated from the response and categorized into 15 groups and subgroups. The most frequent response was for climate/meteorological data with 21 responses. Water quantity had 14 responses. Water quality in general was the next highest with 10 responses.
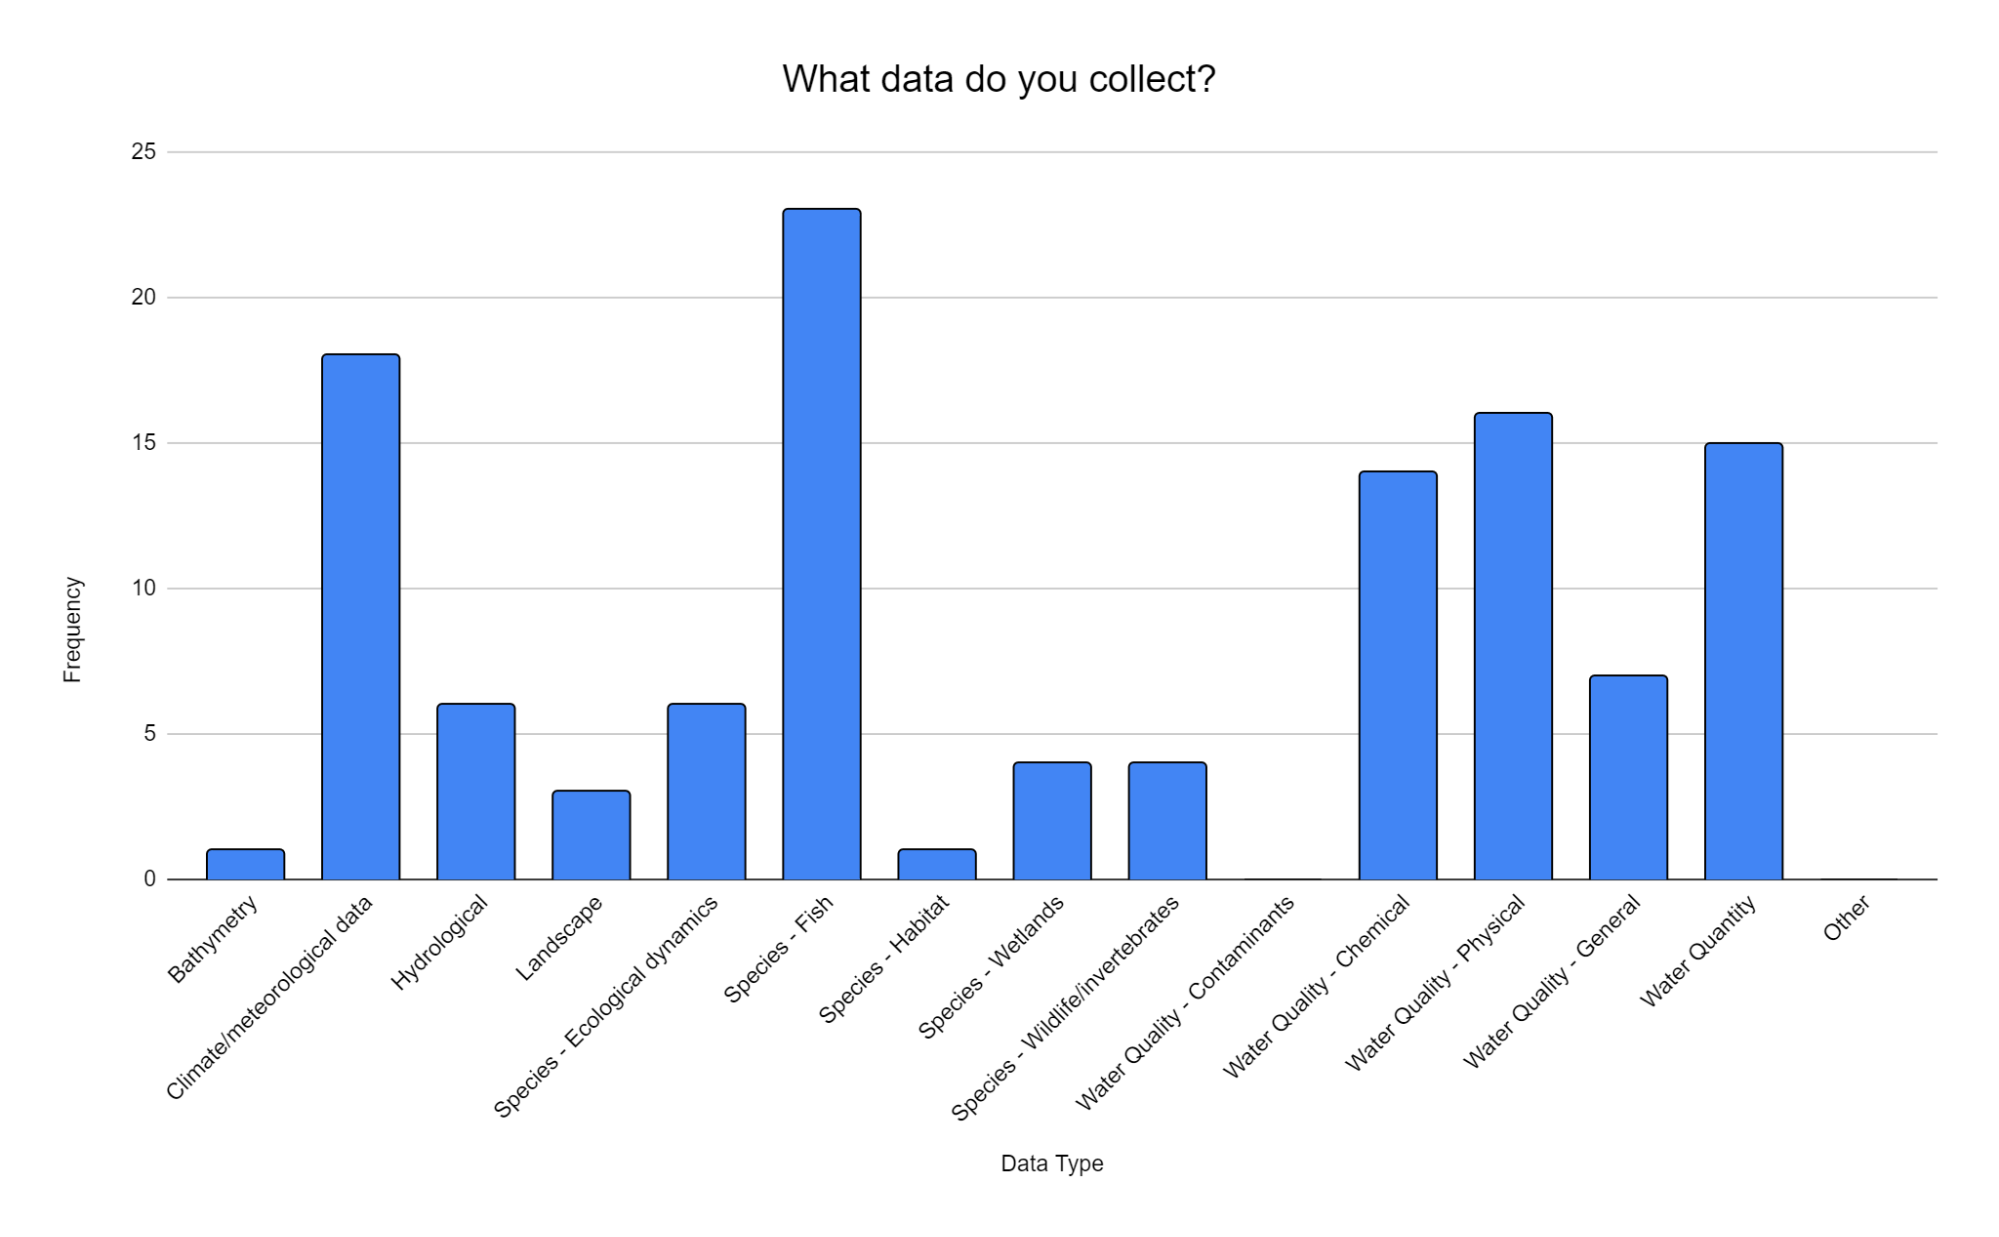
For those who responded that they collected their own data, the survey asked what data they collect. The answers were put into the same broader categories for the question above on what types of data are of interest. Fish data was the most frequent response with 23 responses. Climate/meteorological data was the next frequent with 18 responses. Water quality – physical followed with 16 responses.
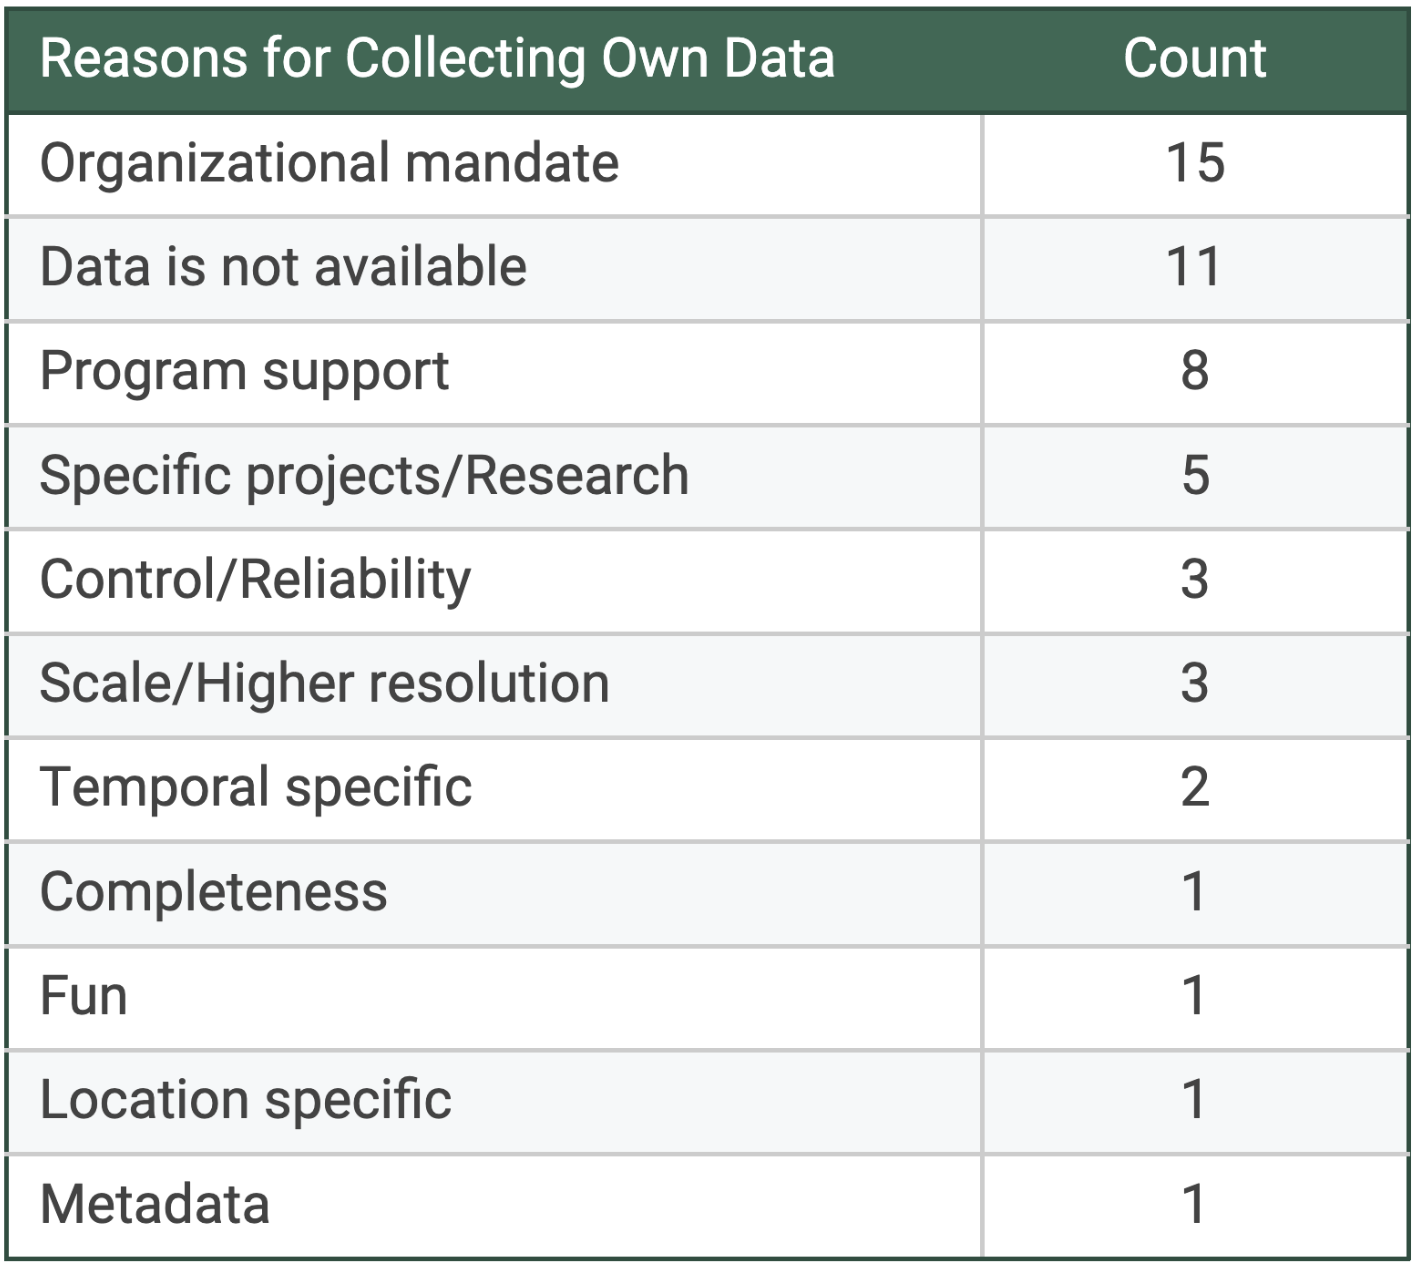
Respondents were asked why they collect their own data, if they are required to collect data per regulations and if the data they require is not available. Since this was an open ended question, answers varied with the most common responses being organization mandates, data is not available and program support.
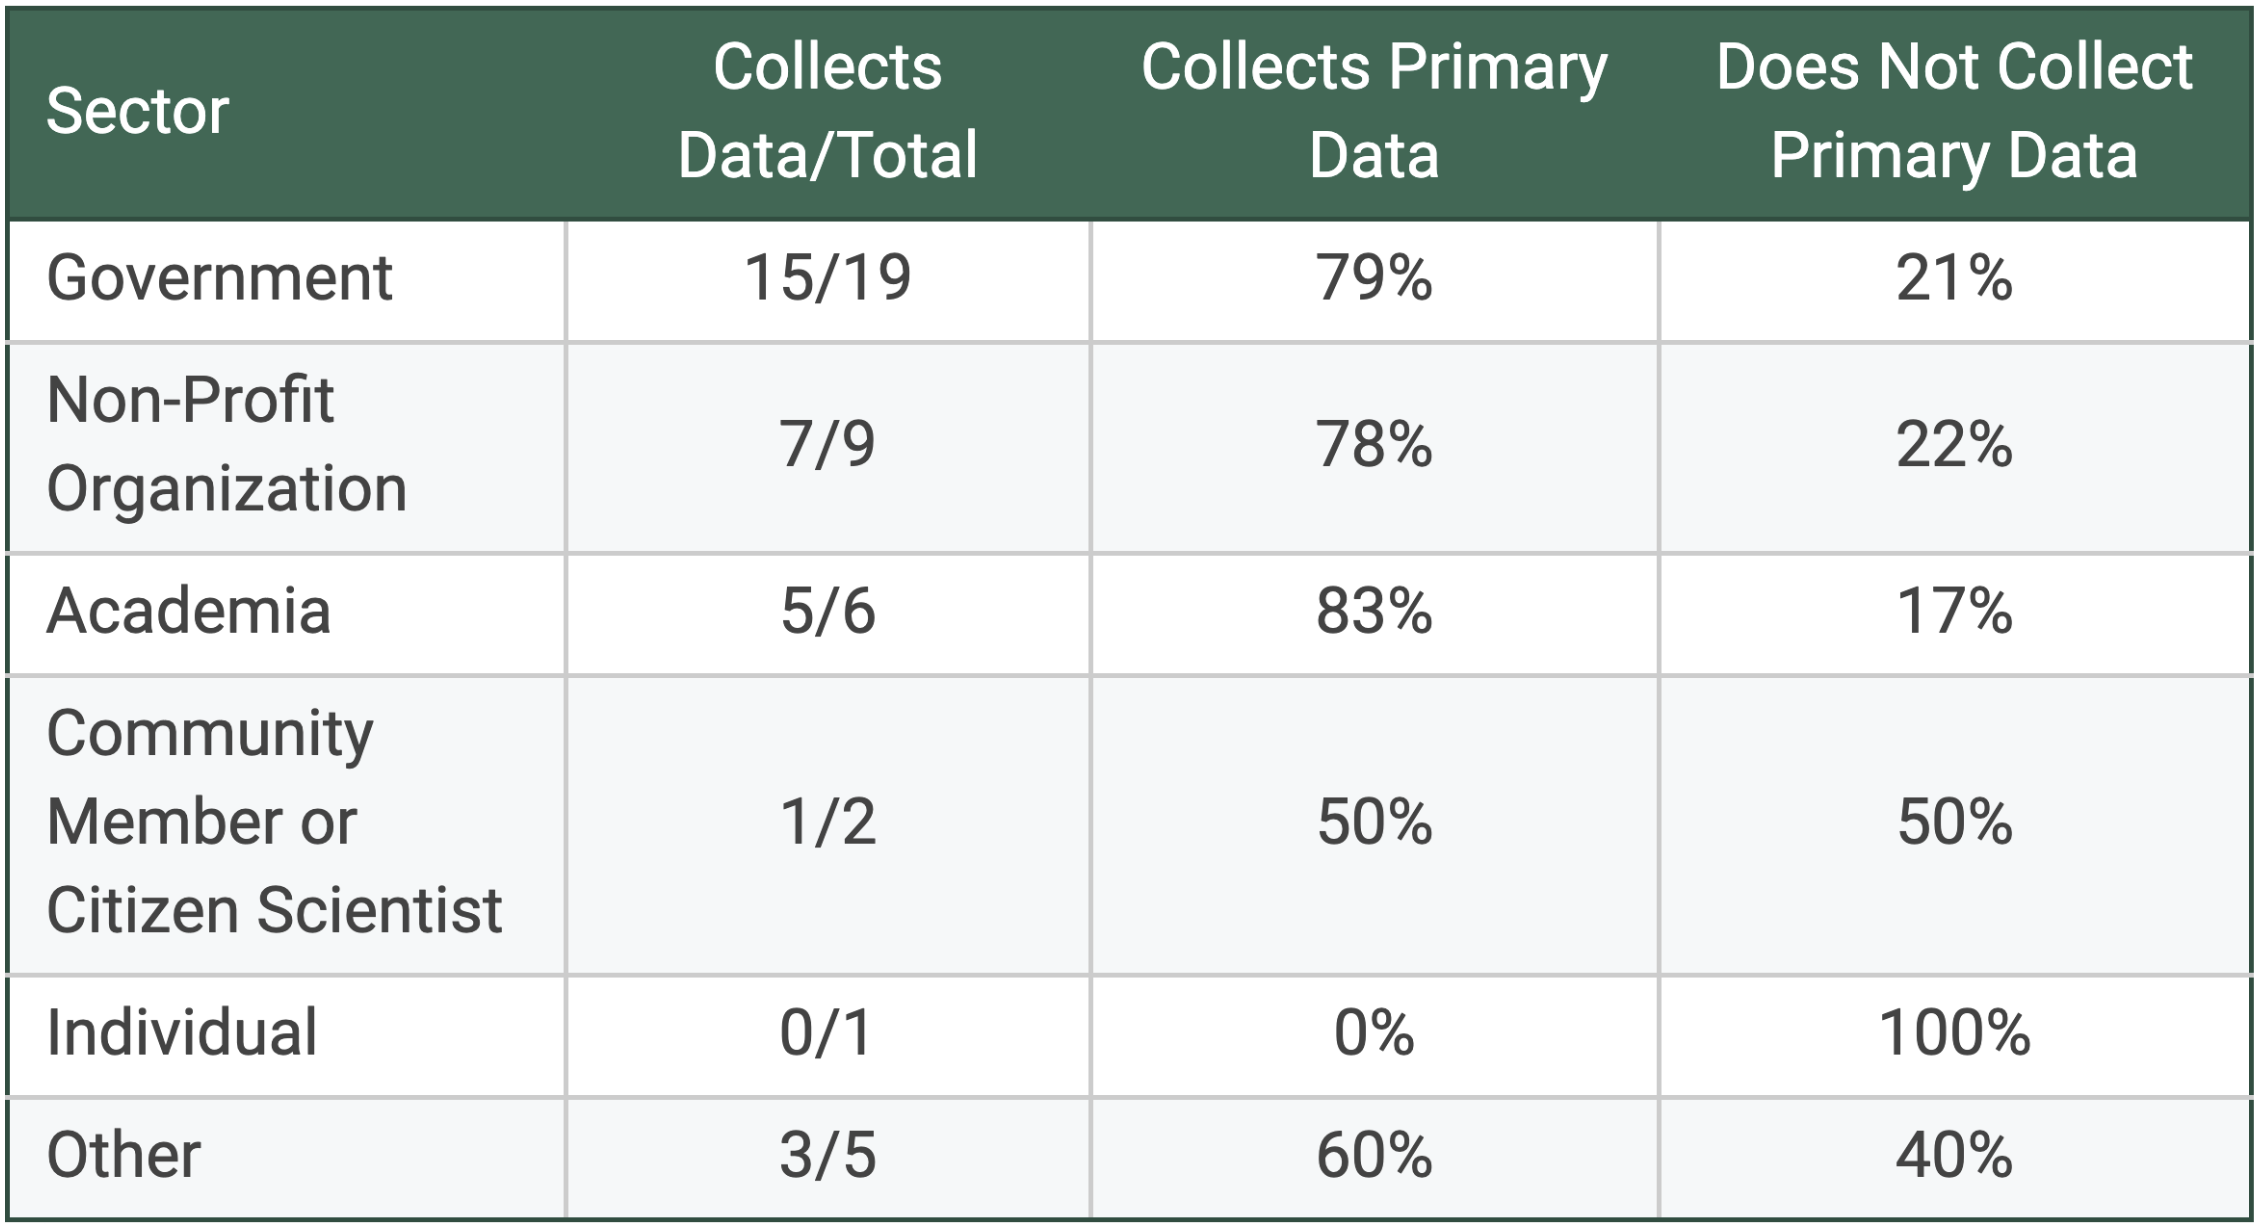
Of the 31 respondents who collect primary data, 28 or 90.32% do share the data whereas 3 or 9.68% said they did not share the data.
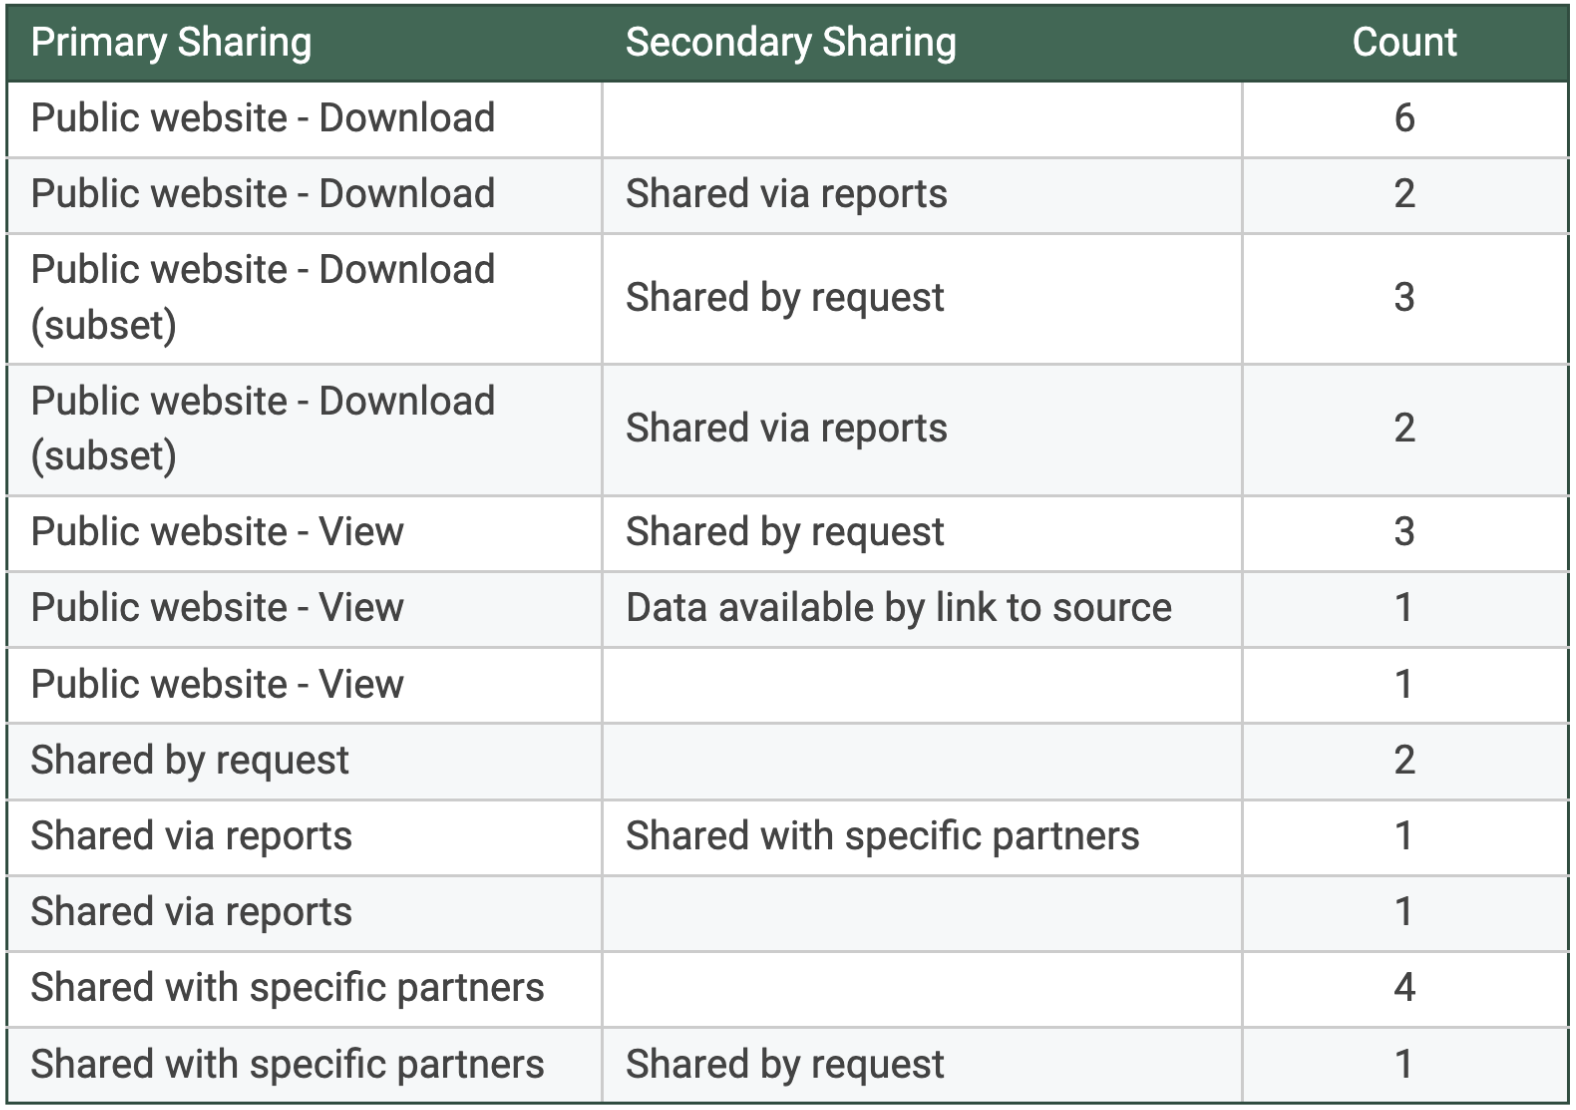
Respondents were then asked to describe how data is shared if they are sharing it. For example, where it is shared and how it is accessed. Twenty-seven responses were received for this question. The responses were categorized using the following definitions:
Public website – Download: Data is available for download from a public website.
Public website – Download (subset): Parts of the data can be downloaded via a public website.
Public website – View: The data is available to view on a public website but is not downloadable.
Shared via reports: Data is contained in reports that are available.
Shared by request: Data must be requested via email or other means.
Shared with specific partners: Data is shared only with select research partners/stakeholders.
Data available by link to source: Third party data that is used is made available via link to original data source.
The survey asked what the barriers or challenges are to sharing the data you collect? Three respondents shared specific barriers or challenges to sharing the data they collected which are categorized and listed below:
- Cost Prohibitive: “Time required for initial data auditing, maintenance, and archiving”
- Data Silos: Data is shared internally with project collaborators, but not to outside organizations
- Data Protection/First Right of Use: “Will likely share data after initial publications”
- Ambiguous Steps to Sharing: “No particular place to send it”
- No Known/Authoritative Repository: Central public Great Lakes repository to upload it to.
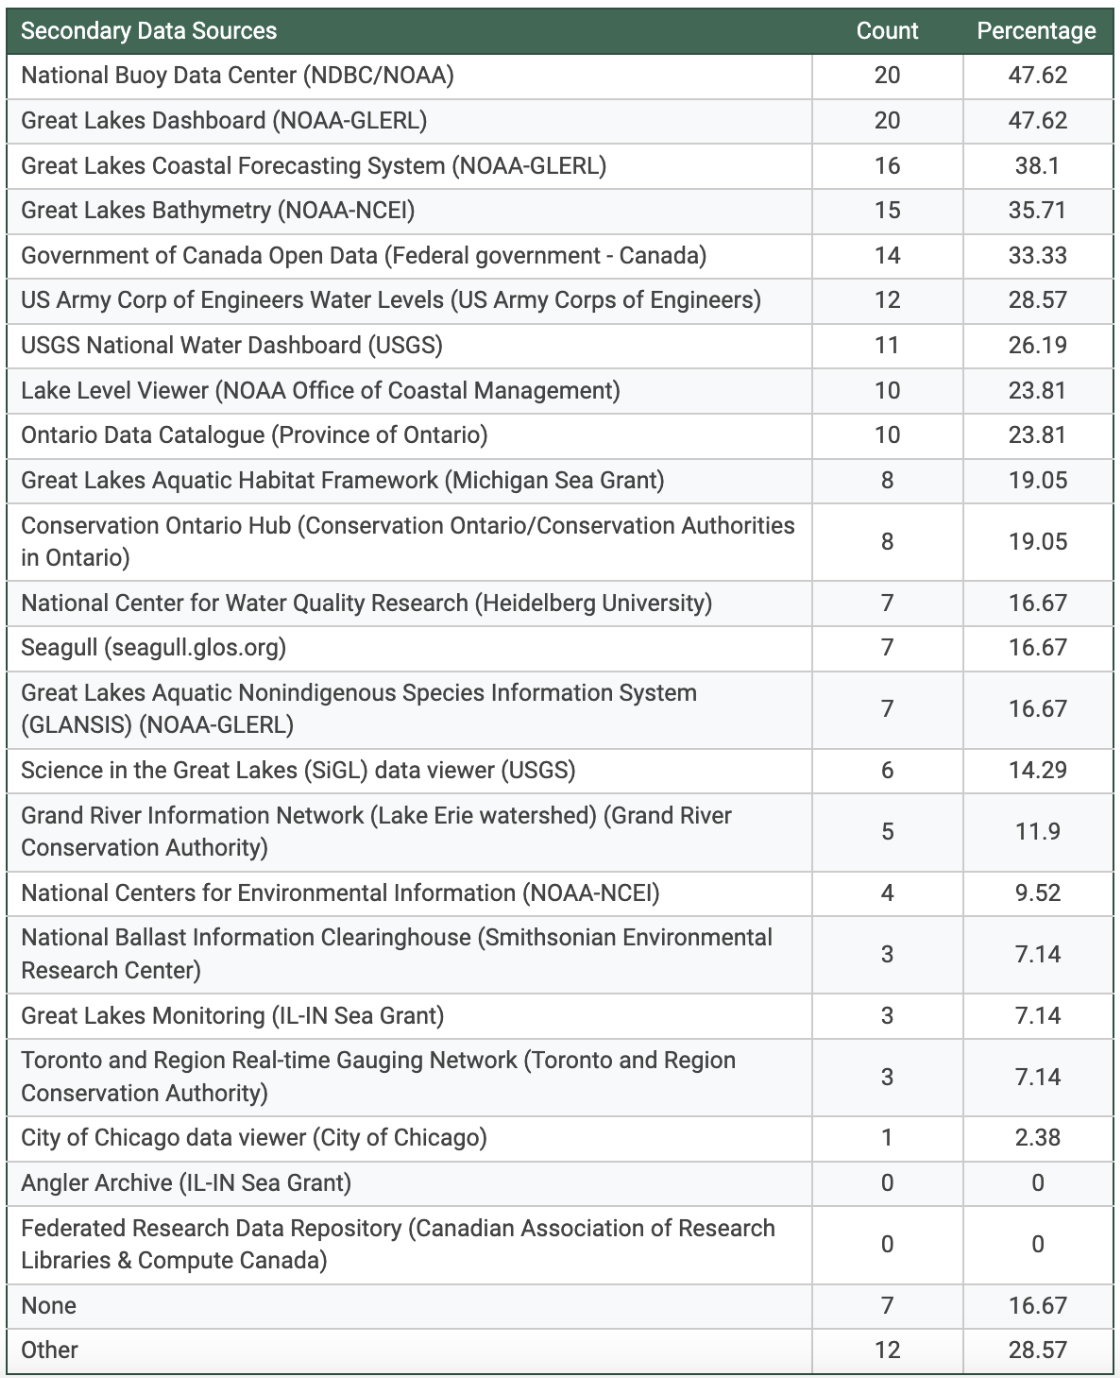
The survey then asked what secondary (third party) data sources they used. While all 42 respondents indicated that they used secondary data sources, 7 did not use any of the listed secondary sources. The top five sites for accessing secondary data were chosen by over 30% of respondents. These were the National Buoy Data Center (NDBC/NOAA), 47.62%, Great Lakes Dashboard (NOAA-GLERL), 47.62%, Great Lakes Coastal Forecasting System (NOAA-GLERL), 38.1%, Great Lakes Bathymetry (NOAA-NCEI), 35.71%, and Government of Canada Open Data (Federal government – Canada), 33.33%.
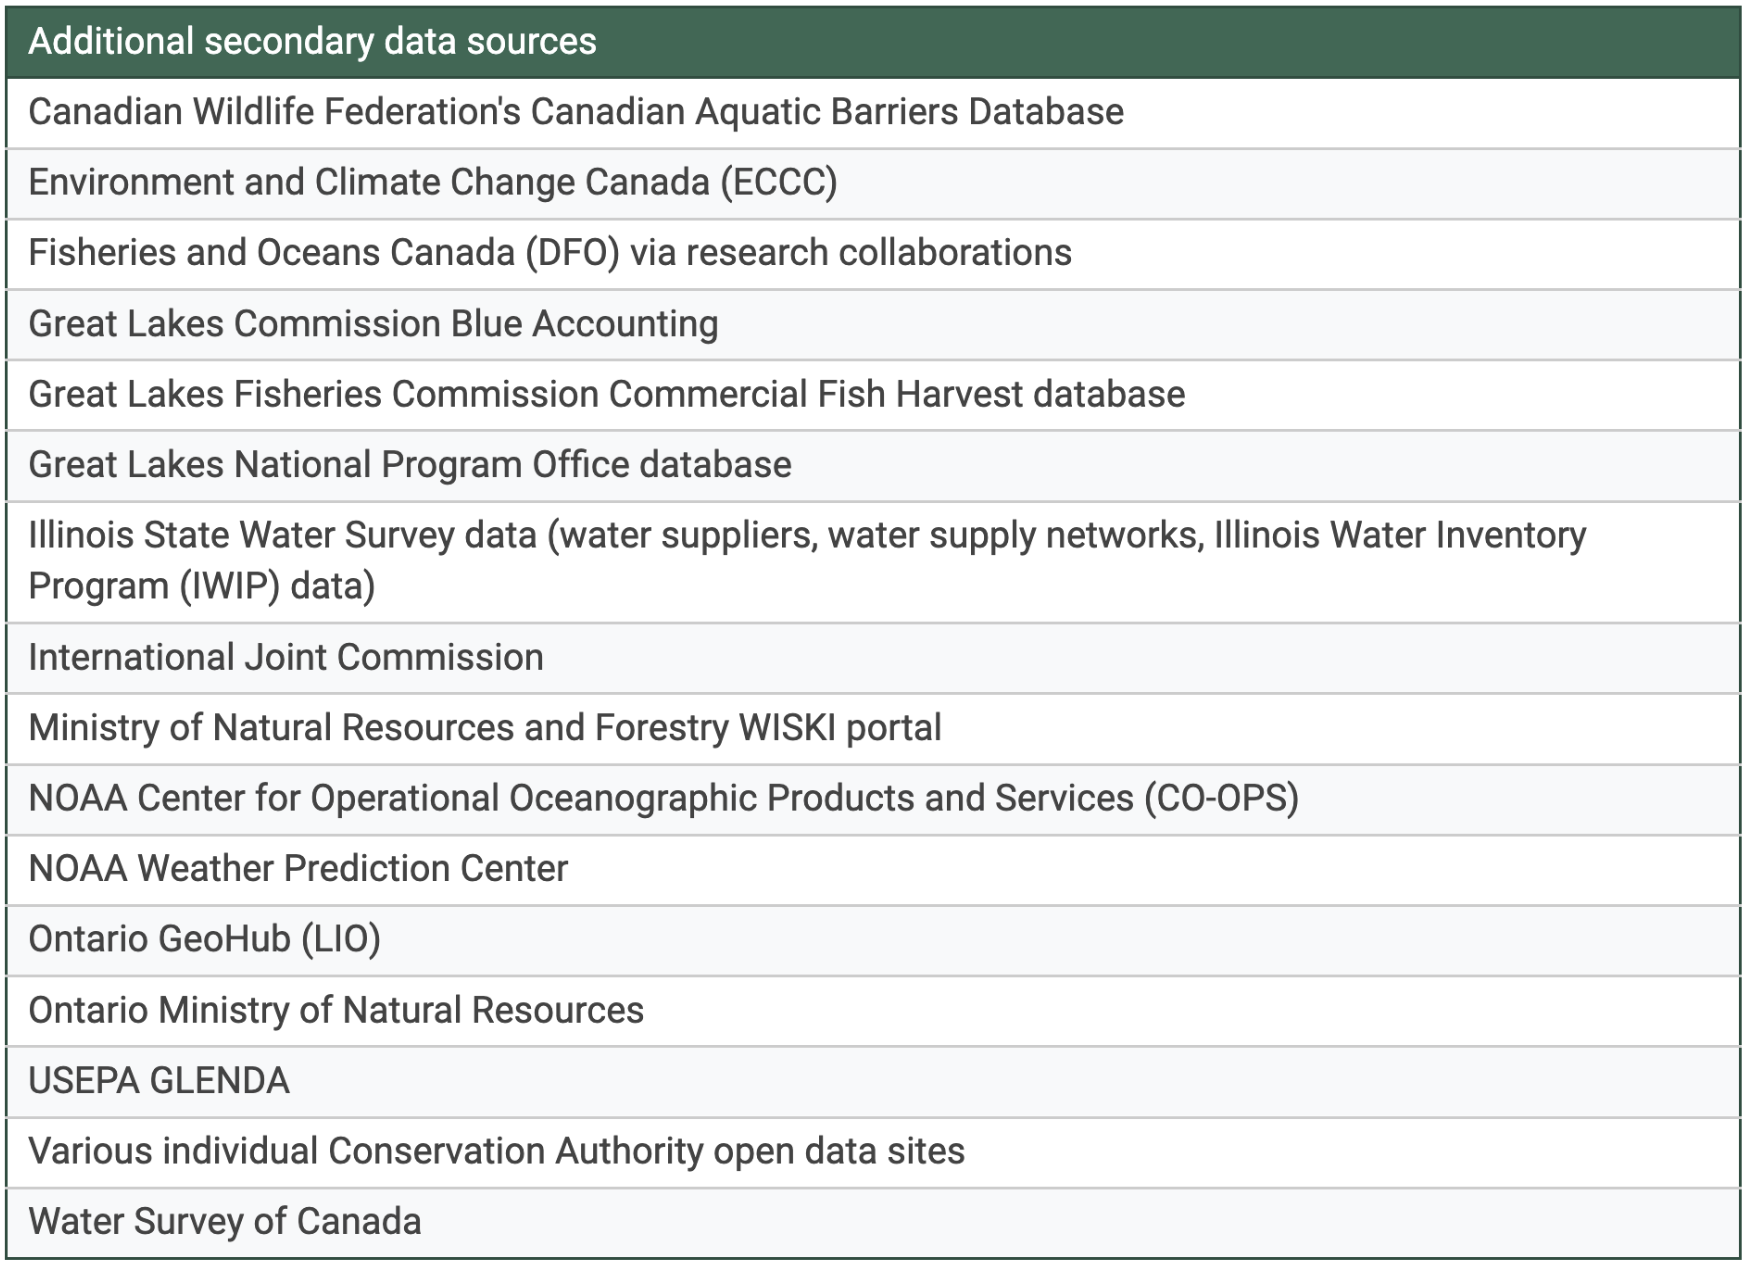
In response to choosing secondary data sources, 12 respondents provided additional data sources that they use that were not on the original list. They are listed in Table 6.
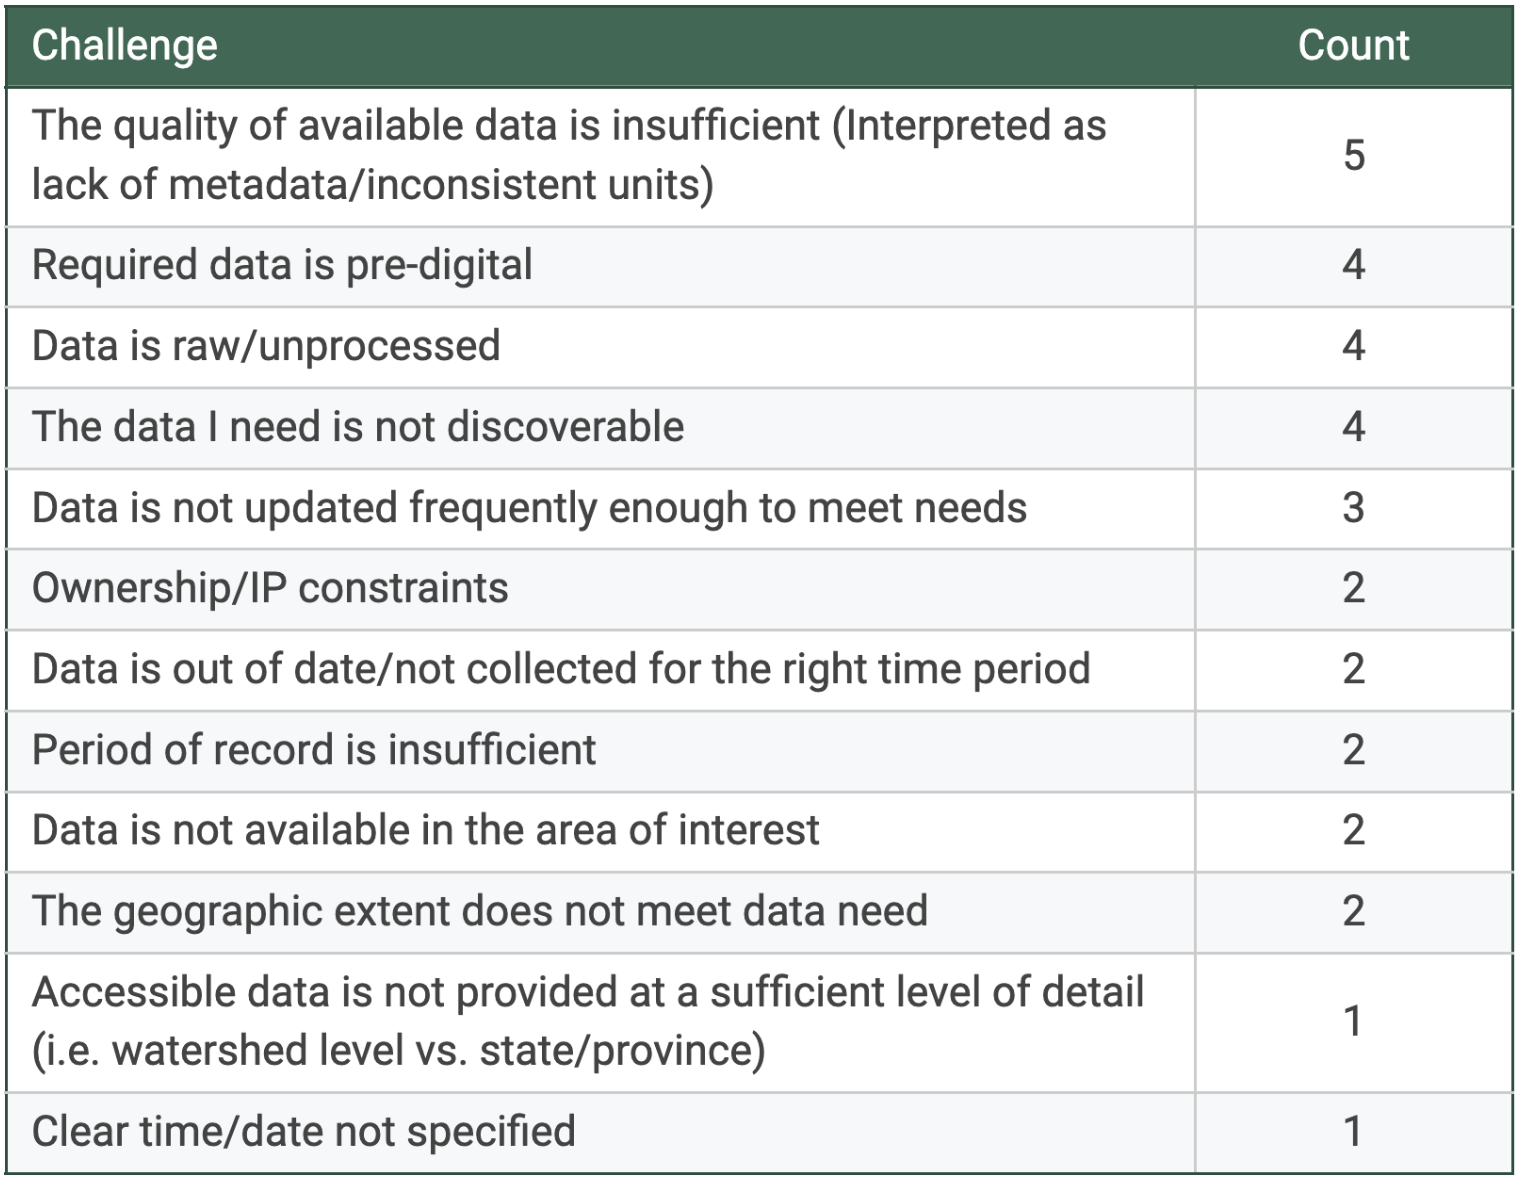
Respondents were asked what are the challenges they have in meeting their data needs. Ten respondents indicated one or more challenges in meeting their data needs. Table 7 below summarizes the issue and number reported.
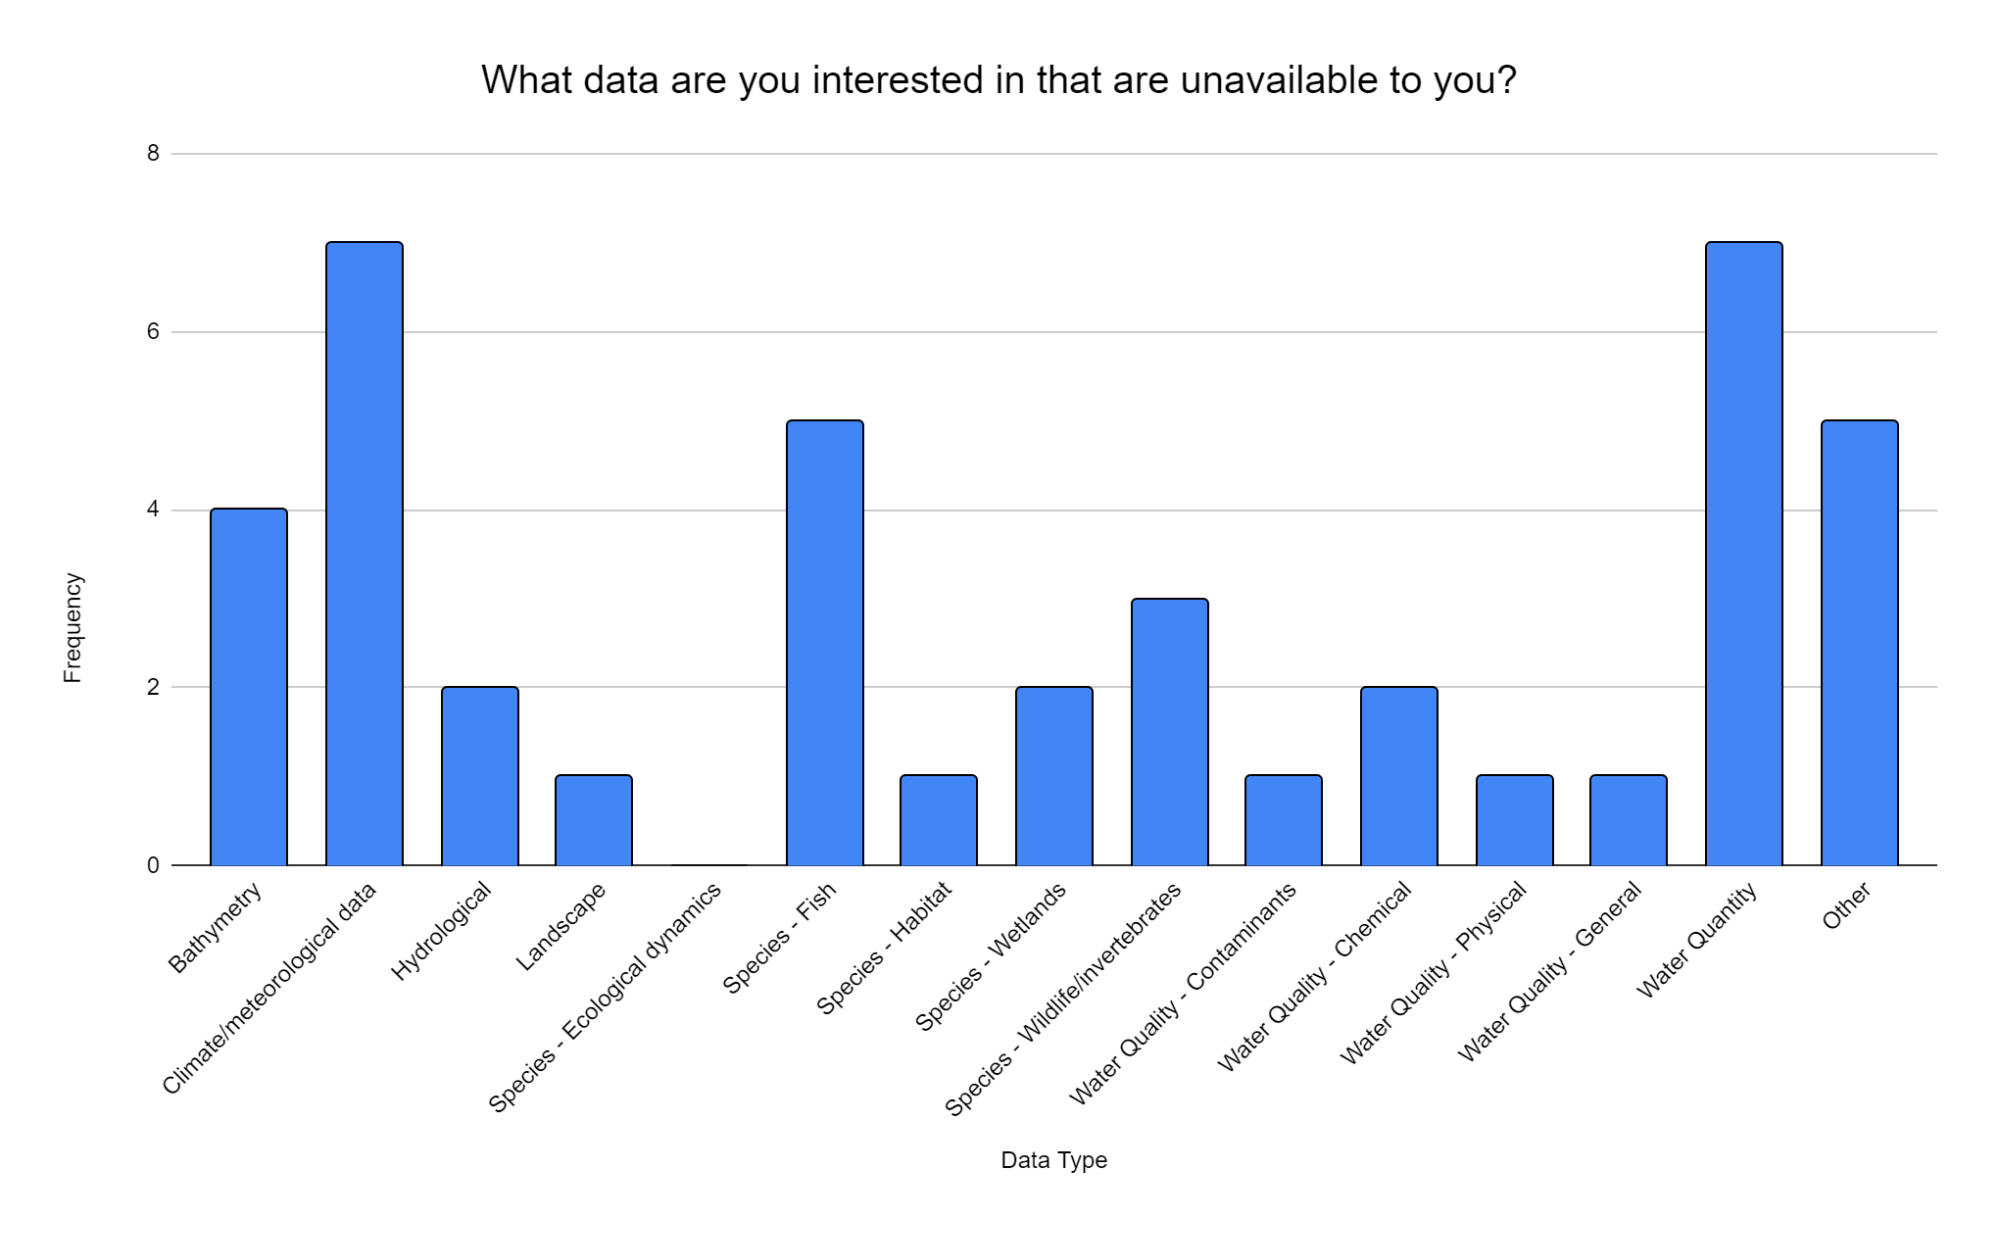
Lastly, the respondents were asked what data they are interested in that are unavailable. Responses were categorized in the same manner as previous questions. Climate/meteorological data and water quantity had the most interest with seven counts each. Fish and “other” data followed in interest with five counts each. Bathymetry was also of interest with four counts.
Survey Feedback

